Official Cash Rate
Official Cash Rate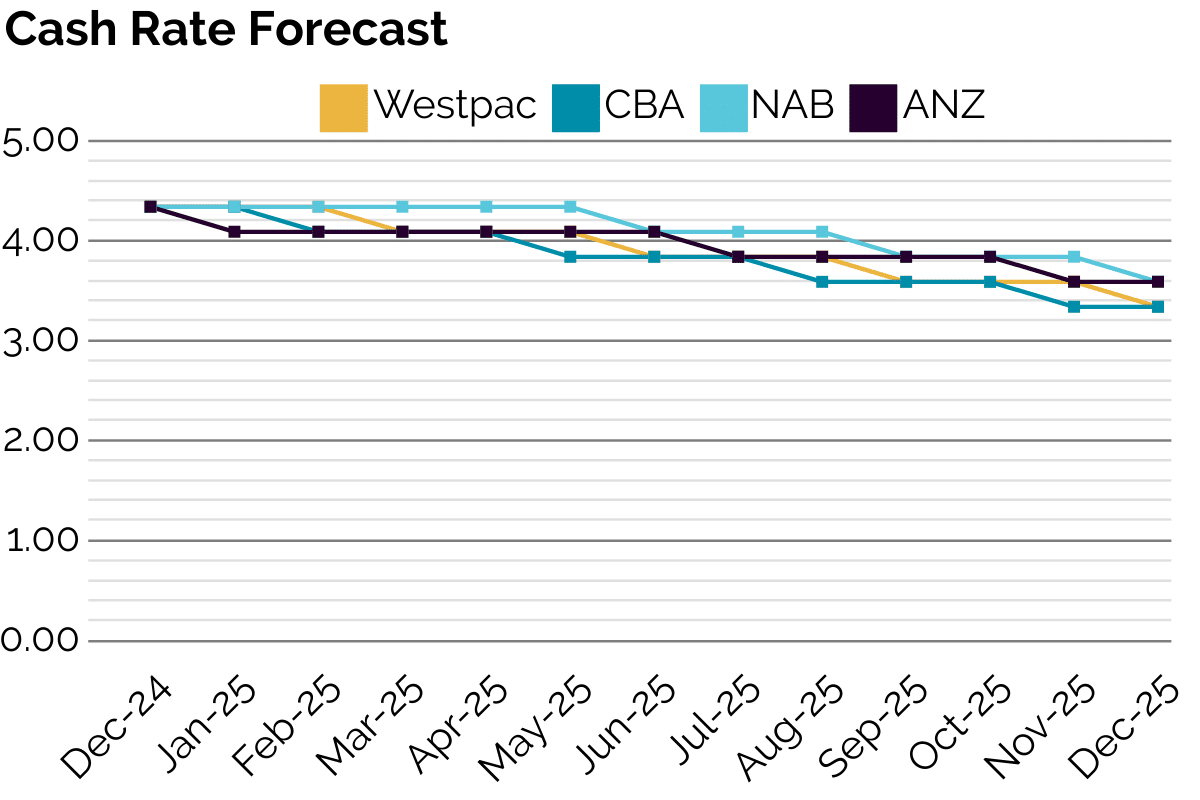
Inflation
Consumer Price Index
The Australian Bureau of Statistics (ABS) reported a 0.2% increase in the Consumer Price Index (CPI) for the December 2024 quarter, with a 2.8% annual rise — its lowest level since March 2021 — driven by declining housing and transport costs, alongside federal energy bill relief measures. Significant price increases were observed in Recreation and culture (+1.3%), Food and non-alcoholic beverages (+0.6%), and Alcohol and tobacco (+1.3%), while Housing prices recorded a marginal decrease of 0.1%. At the same time, headline inflation slowed to 2.4%, primarily catalysed by a reduction in housing and transport costs, in conjunction with the federal government’s energy bill relief measures. Notably, electricity prices fell by 9.9% in Q4, following a 17.3% drop in Q3, indicative of the positive price-based externalities that have resulted from the State and Federal government energy subsidies.
Despite inflation trending lower, the RBA has maintained that it does not expect inflation to sustainably return to the 2-3% target range until 2026 due to persistent cost pressures and sluggish GDP growth. This has intensified debate around monetary policy, with bond markets now pricing in a 95% probability of a rate cut at the RBA’s February 18 meeting, up from 75% before the CPI release. Similarly, market participants had already priced in an 84% probability of a rate cut before the latest inflation data, and the new figures have strengthened expectations of three cuts in 2025. Bendigo Bank’s chief economist stated that inflation is now safely within the RBA’s target band, increasing the likelihood of an easing cycle. However, some economists remain cautious, arguing that the RBA may prefer to wait for additional data before adjusting rates, especially given that the cash rate remains at a 13-year high of 4.35%. KPMG’s Brendan Rynne suggests that the RBA may hold rates steady until May to ensure inflationary pressures have sufficiently moderated. Meanwhile, the CPI data has fuelled optimism in financial markets, with the ASX 200 rallying to near record highs as investors anticipate looser monetary policy to support economic growth.
Population & Employment
Population
As of June 30, 2024, Australia’s population reached 27.20 million, reflecting an annual growth of 552,000 people, or a 2.1% growth rate. This increase is primarily driven by net overseas migration (NOM), which contributed 445,600 people, alongside a natural increase of 106,400 people. On a state and territory level, demographic changes vary significantly. New South Wales, Victoria, and Queensland continue to attract the largest shares of the population. As of June 2024, New South Wales exhibited a population of approximately 8.2 million people, whilst Victoria recorded 6.7 million, and Queensland reached 5.2 million. Substantial growth is occurring in NSW, Victoria, and Queensland, catalysed by major growth in each city, evidenced through Melbourne experiencing a 2.4% population growth in 2024 and Brisbane growing by 2.3%. These urban areas are expected to experience intensified demand for residential and commercial property, thereby boosting credit activity, particularly in real estate financing and infrastructure projects. Moreover, regional areas have experienced strong growth, driven by a decentralisation trend as people seek more affordable living options outside of metropolitan centres. This trend is evidenced by both regional Queensland and New South Wales, who experienced population growth of 1.7% and 1.01%, respectively, in the past year. This shift could present both challenges and opportunities for private credit markets, as lenders need to adapt to diverse local economic conditions. The growth of regional areas may result in a greater need for tailored financing products but may also increase risk exposure in less-established markets.
Employment
As of December 2024, Australia’s unemployment rate remained steady at 4.0%, with a slight increase from 3.9% in November, reflecting ongoing stability in the national labour market. Total employment reached 14.57 million people, with an employment-to-population ratio of 64.4%, and the participation rate holding steady at 67.1%. Notably, underemployment decreased slightly to 6.0%, while monthly hours worked increased to 1.98 billion, indicating stronger labour force participation and job retention. At the state level, New South Wales (NSW) reported an unemployment rate of 3.9%, below the national average, and experienced an increase of 51,600 full-time jobs. Similarly, Victoria and Queensland conformed to the trend of consistent employment growth, with Queensland’s labour force benefiting from the growing demand in industries like construction and services. Full-time employment across the nation fell by 23,700, but part-time employment grew by 80,000, indicating a shift towards more flexible working arrangements.
The overall employment increase of 31,000 people in trend terms was partly driven by sectors in urban areas like Sydney, Melbourne, and Brisbane, where migration trends continue to place pressure on housing and infrastructure. This growing urbanisation is evident with Sydney, Melbourne, and Brisbane continuing to attract large populations, influencing demand for real estate and subsequently private credit markets, especially in mortgage products. The increase in part-time positions in multiple states, however, suggests that while overall employment remains stable, there are ongoing challenges related to securing full-time work, potentially impacting household cash flow in certain sectors. Despite this, the 3.1% increase in total employment over the year, along with the stable underemployment rate, indicates that the labour market remains resilient, providing a favourable environment for credit risk in both urban and regional markets.
Housing
Dwelling Approvals
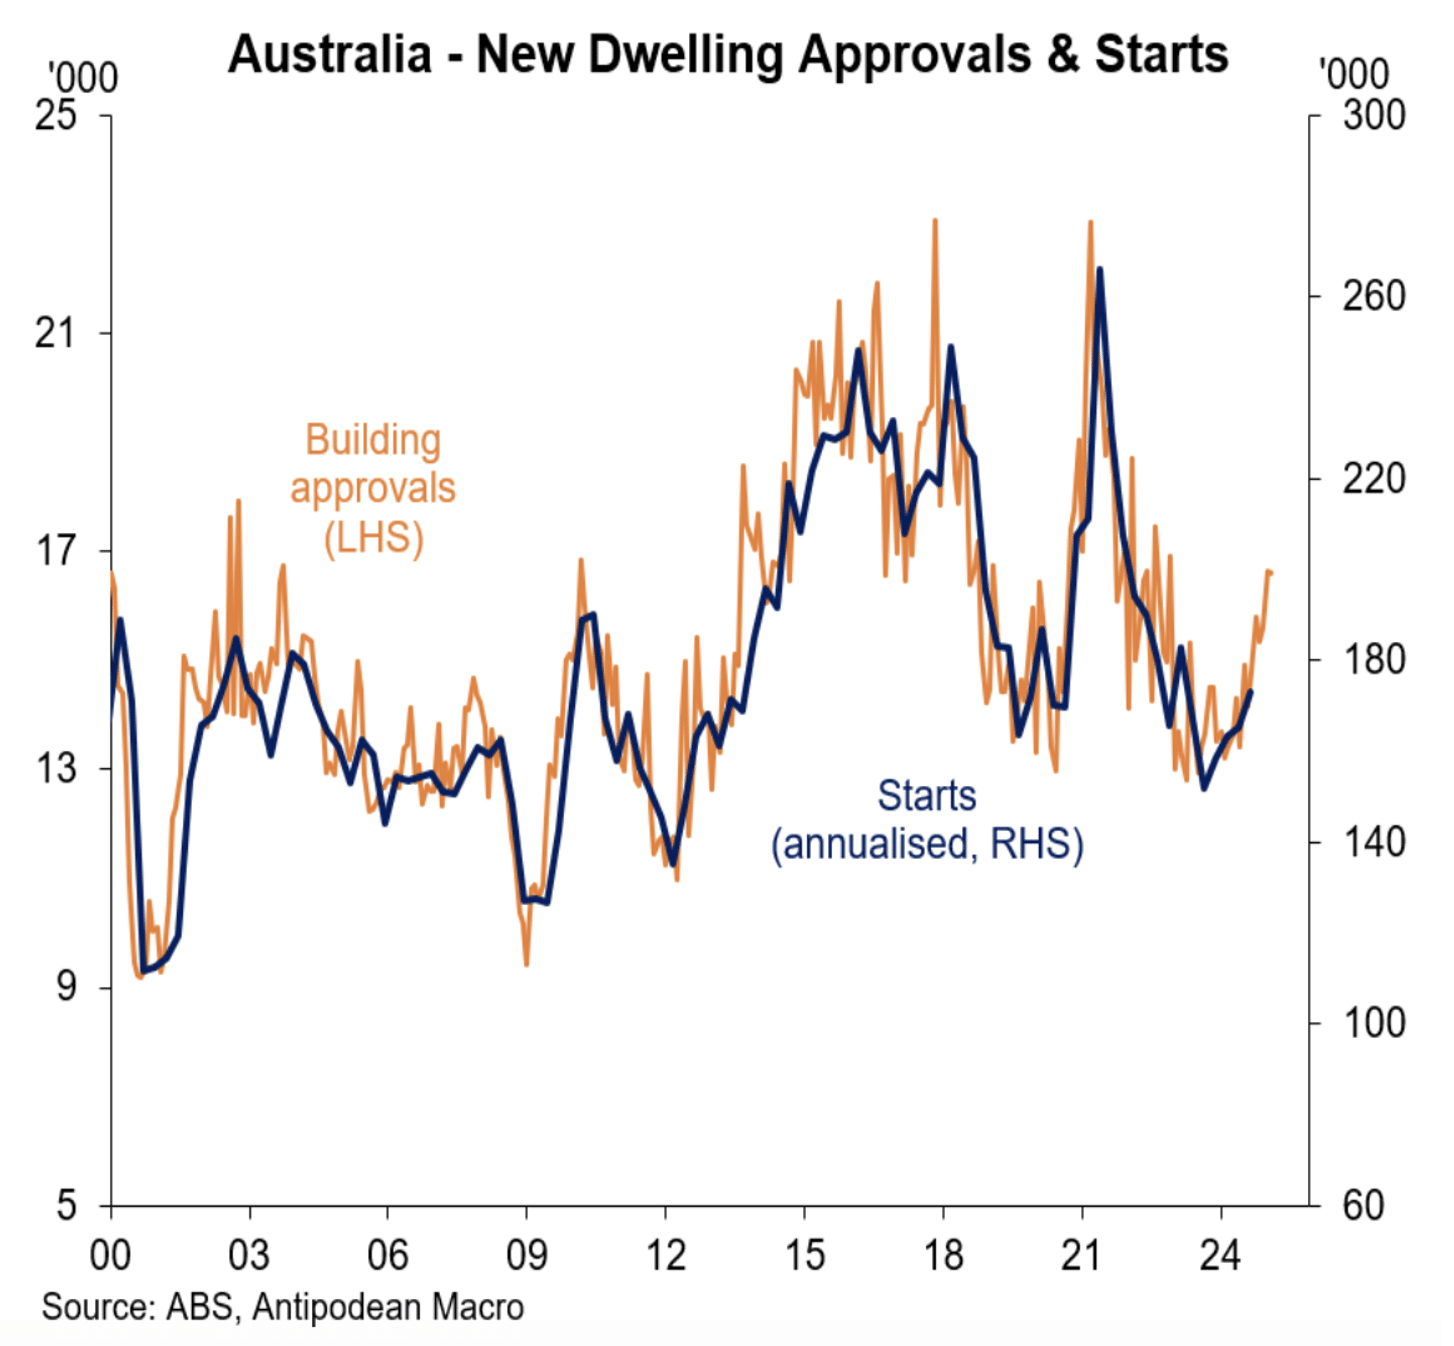
For the year to November 2024, Australia’s residential building approvals experienced a discernible decline, evidenced by total dwelling approvals falling 3.6% month-over-month to 14,998, despite exhibiting a 3.2% increase year-over-year to 169,000. The number of private sector houses approved decreased by 1.7% to 9,028, while approvals for private sector dwellings excluding houses dropped sharply by 10.8% to 5,285. This decline is confirmative with the broader trend of a decrease in residential building values, which fell 0.5% to $8.36 billion. In contrast, the non-residential building sector experienced a significant 18.4% rise in value, reaching $5.96 billion. On a state level, approvals varied widely: Western Australia (18.1%) and Queensland (7.3%) experienced increases, while New South Wales (-9.9%), Victoria (-12.9%), South Australia (-1.6%), and Tasmania (-4.2%) all experienced declines in total dwelling approvals. Meanwhile, the housing construction sector exhibited signs of recovery – with residential construction value rising by 1.8% in the September quarter to $23.4 billion, indicative of the highest quarterly figure in three years. This increase was driven by a response to stabilising borrowing and building costs, signalling a potential uptick in residential investment. However, concerns about trade labour shortages and capacity constraints continue to challenge the sector. Conversely, despite approvals for new-attached homes increasing by 8.4% in September, the overall outlook remains cautious, with some economists forecasting modest growth in FY2025.
When considering trends on a national level, dwelling approvals remain grossly subdued, continuing a three-year trend of underperformance – reflective of entrenched planning challenges, catalysed from bureaucratic delays and insistent community opposition to development. This is evidenced by the Property Council reporting that that just over half (54%) of NSW councils are meeting their residential development assessment processing targets as well as by only 171,394 new homes being approved nationally in 2024, falling short of the 240,000 annual approvals required to meet the National Housing Accord’s goal of 1.2 million new homes by 2029. Amidst these government-administrative bottlenecks, this trend of underperformance has been further compounded by persistent pressures from high interest rates, elevated land prices, and rising construction costs, all in which have disincentivised developer activity. However, potential policy tailwinds, such as fast-tracked development approvals, may provide some relief and stimulate an increase in dwelling approvals. These legislative tailwinds include the NSW Government introducing a five-year housing completion target for 43 local government areas across Greater Sydney, Illawarra-Shoalhaven, Central Coast, Lower Hunter, and Greater Newcastle, with a broader state-wide target under the National Housing Accord to deliver 377,000 new homes by 2029. These targets focus on delivering more diverse, well-located housing in areas with existing infrastructure capacity, such as transport and water servicing, with financial incentives and infrastructure funding in place to support councils in achieving these goals.
Median Dwelling Price
As of September 2024, Australia’s housing market has recorded a seemingly perdurable upward trend, with the national median dwelling price rising by 0.7% month-over-month, reaching a new high of $807,110. Despite this growth, the pace at which each individual State and Territory is expanding remains fragmented across the country. Sydney continues to lead as the most expensive market, with a median house price of $1.23 million, reflecting a 0.9% increase over the quarter. However, after the market plateaued in January 2022, Sydney prices are expected to remain relatively stable for the remainder of 2024. Elsewhere, Perth, Adelaide, and Brisbane continue to experience solid growth, with Perth seeing a 1.6% increase in dwelling values in September 2024, however, the national market’s momentum has slowed. Nationally, dwelling values rose by 0.4% in September, driven by solid performance in Queensland, which catalysed a 2.9% rise, and Western Australia, which experienced a 5.0% increase. Conversely, Victoria, Tasmania, and the ACT experienced slight declines. The total value of residential dwellings in Australia surpassed $11 trillion for the first time, with the mean dwelling price across the country reaching $985,900. Despite the overall deceleration in growth, Perth and Brisbane continue to see strong demand, particularly due to affordability and demographic trends. Melbourne, on the other hand, struggles with a 1.1% decline in dwelling prices over the past quarter.
The incessant increase in land prices is contributing to a shift in the housing market, pushing buyers away from expensive metropolitan areas like Sydney and toward more affordable regions. In Sydney, land prices reached a record $2,011 per square metre, a 9.3% increase year-on-year, which led to a 25% drop in lot sales for the city. Conversely, Adelaide anomalously recorded growth in land sales, with a 33% increase in lot sales and a rise in median land prices of 18.9%, despite higher land costs. This is reflective of trends within the broader national housing market, with the median price of residential land increasing by 4.5% quarter-on-quarter and 7.6% year-on-year. In turn, we can conclude that the rise in prices, particularly in capital cities, is exacerbating affordability challenges for new homebuyers, pushing demand into more affordable regions. These trends contribute to the broader housing market dynamics, where the national median dwelling price has increased to $807,110, marking a continued pattern of regional growth and a slowing of price momentum in higher-cost areas.
Vacancy Rates
Australia’s national rental vacancy rate has seen a significant shift, with the latest data from November 2024 showing a national vacancy rate of 1.36%. This is a notable increase from the previous month’s rate of 1.17%, driven by a 0.31% rise in Sydney, evidenced by a vacancy rate of 1.57%. Despite this ascension, the overall vacancy rate remains well below the 3% threshold considered indicative of a balanced market. Melbourne and Brisbane experienced marginal increases, with Melbourne’s vacancy rate rising to 1.64% and Brisbane’s improving to 1.07%. However, regional areas experienced a marginal contraction in vacancies by 0.13%. Hobart continues to have the lowest vacancy rate at just 0.82%.
With migration still driving demand, Australia’s rental market remains under pressure, and the tight supply of rental properties is expected to persist, particularly in high-demand cities. The national vacancy rate, though rising, remains far from ideal for renters, and affordability challenges are anticipated to continue. For private credit markets, these persistently low rental vacancy rates signal sustained demand for housing, which can reinforce investor confidence in real estate-backed lending. However, affordability constraints and rising interest rates could introduce challenges, particularly for borrowers with high leverage.
House Rental Rates
Australia’s rental market has seen a notable slowdown, juxtaposing the surge in growth over the past four years, with rental price increases across capital cities largely flatlining or even declining in some areas. The latest data reveals a 0% quarterly growth across combined capital cities, marking the weakest rental growth in years, with annual gains for houses at 8.3% and units at 5%. While Sydney experienced significant rent increases, Brisbane experienced its first rent declines since 2020, and Perth recorded sharp rent rises. Despite a general easing in rental conditions, supply remains limited in many cities, contributing to a landlord’s market. Rental yields are stable at 3.7% nationally, but regional areas show higher yields, reflecting stronger rental growth and slower price increases.
From a renter’s perspective, the Sydney rental market is in crisis, marked by severe undersupply, extremely low vacancy rates, and high demand catalysed by population growth and ascending construction costs. Despite some stabilisation, rents continue to surge, with average house rents reaching $775 per week, indicating a bleak future for renters in the city. Combined with a low vacancy rate of 1.6%, competition for rental properties is intense, further exacerbating the shortage of available homes. Factors such as rising construction costs, a limited pipeline of new housing projects, and regulatory hurdles have deterred investors, contributing to the scarcity of rental properties. Additionally, the influx of skilled immigrants and overseas students has put further strain on the market, while increased demand has pushed rental prices to record highs.